Social proof that converts: what to show, where, and to whom
Your site already carries testimonials, customer logos and a review score, and the conversion rate has not moved. Here is a way to decide which proof each visitor needs, where on the path they need it, and how to check that it worked.
- Proof works when it answers a live doubt. A testimonial, logo or rating lifts the primary conversion only when it meets the specific hesitation at the step where visitors stall; the same block shown to everyone is mostly skipped.
- Start from the funnel, not the testimonial library. Break the path into steps, split by traffic source, and assign one doubt and one proof type to each drop point.
- Polished proof can cost trust. Spiegel Research Center found purchase likelihood peaks at 4.0 to 4.7 stars, not 5.0, and since October 2024 a US rule lets the FTC seek penalties for fake reviews and testimonials.
- Judge it on the conversion, with a holdout. Clicks on a testimonial prove nothing; compare the demo request rate against a control group that did not see the proof.
Spiegel Research Center’s 2017 study of online reviews found that the purchase likelihood for a product with five reviews is 270% greater than for a product with none, and that the gain flattens quickly after those first few reviews. The study is old and it covers product reviews in retail, but the shape of the finding still holds: the first credible evidence matters a great deal, and piling on more of the same matters very little. Social proof raises conversion when it answers the specific doubt a visitor has at the point where they hesitate. The same testimonial shown to everyone, everywhere, mostly gets ignored, and proof that looks staged can lower trust.
So the useful decision is not “which testimonials do we add” but three narrower ones: what doubt, where on the path, and which visitor. This article works through them for the site’s primary conversion (a purchase for a store, a demo request for B2B). To keep the numbers honest it follows one worked example from start to finish: demo requests on a B2B software site.
It covers how to find the drop points, which type of social proof answers which doubt, where to place it, what to show first-time paid visitors against returning ones, how to measure the result, and when social proof is the wrong fix. It supports our guide to conversion rate optimization.
Why most social proof gets ignored
Most sites treat social proof as a section: a logo strip under the hero, a testimonial carousel above the footer, a badge row in between. The section exists, so the box is ticked, and nobody asks which visitor it was for. That is why adding more of it rarely changes the number that matters.
Visitors do rely on other people’s experience. In BrightLocal’s Local Consumer Review Survey 2026 (1,002 US adults, about local businesses), 49% said they trust reviews as much as personal recommendations, 74% look for reviews written in the last three months, and 47% will not use a business with fewer than 20 reviews. Read those three numbers together: trust is conditional. It depends on recency, volume and whether the evidence looks like it came from a real customer.
Robert Cialdini described the mechanism in Influence: under uncertainty people look at what similar others did. The operative words are uncertainty and similar. A visitor who is not uncertain about the thing your testimonial praises gets nothing from it, and a visitor who does not see themselves in the customer quoted discounts it. Proof that answers the wrong doubt is decoration.
- Is this for a company like mine?
- Does it work?
- What happens after I submit?
- Landing page headline
- Pricing table
- Demo form and its button
- Awareness, consideration, decision
- First-time or returning
- Paid or organic arrival

The rest of this article is those three questions, in order. If your overall rate is low and you do not yet know whether the cause is the traffic or the site, settle that first with this diagnosis of traffic quality against website problems, because proof cannot fix visitors who were never going to buy.
Where do visitors drop before they convert?
Find the drop points by breaking the path to the conversion into steps and counting how many visitors each step loses, split by traffic source. A sitewide conversion rate tells you that visitors leave. It does not tell you where, and the where decides which proof is worth building.
Hypothetical example Take a B2B software site with 60,000 monthly visits and 600 demo requests, a 1.0% rate (600 / 60,000). Step by step: 21,000 visits reach a product or pricing page (35%), 2,400 open the demo form (11.4% of those 21,000), and 600 send it (25% of 2,400). The losses are 39,000, then 18,600, then 1,800.
Each loss has a different cause. The 39,000 who never reach a product or pricing page mostly doubt relevance. The 18,600 who read pricing and do not open the form doubt the result or the price. The 1,800 who open the form and leave doubt the commitment: who will call, how long it takes, whether they will be pushed. A testimonial that says “great team, great product” answers none of the three.
Then split by source. In the same example, paid traffic brings 20,000 of the visits and 120 demo requests (0.6%), while the other 40,000 visits bring 480 (1.2%). Paid visitors are more often first-time and arrived on a promise made in an ad, so their first doubt is whether the page delivers that promise. To run this on your own site:
- List the three or four steps between landing and the primary conversion. For a demo request: landing, product or pricing page, form opened, form sent.
- Count visits at each step for the last 30 to 90 days and compute the loss between steps, in visits and as a percentage.
- Repeat the count for paid and for organic arrivals, and for first-time and returning visitors. Keep the segments separate.
- For the biggest loss in each segment, write the doubt in the visitor’s words. Use sales call notes, chat logs and on-site search terms, not guesses.
- Only then choose the proof, using the table in the next section.
If a step loses visitors because the page is slow, the form is broken on mobile or the price is hidden, proof is not the fix. Check the mechanics first. On pricing specifically, see how gated pricing affects demo conversion.
Types of social proof and the doubt each answers
Each type of social proof reduces a different doubt, so the type is chosen by the doubt, not by what the team happens to have on file. The six types below are the ones most sites already own in some form. The last column matters as much as the first three.
| Type | Doubt it reduces | Where it works | When it backfires |
|---|---|---|---|
| Ratings and reviews | Is it as good as the page claims? | Beside the price or the main button, with the count and the date visible | Perfect scores, very few reviews, old reviews, no critical ones |
| Customer testimonials and case studies | Does it work for a company like mine? | Product and pricing pages, matched to the visitor’s segment, with a measured result | Generic praise, no name or role, a customer the visitor cannot relate to |
| Expert endorsement | Is the approach sound? | Early in the journey, on content that explains the method | An expert the audience does not recognise, or a paid relationship that is not disclosed |
| Certifications and awards | Is it safe and compliant to choose this? | Near forms, payment and security questions | Badge walls with unknown issuers, or awards several years old |
| User-generated content | What is it like in real use? | Product detail, where the visitor is picturing use | Content used without permission, or so polished it reads as an ad |
| Referrals and celebrity or influencer endorsement | Do people I know or follow use it? | Before the visit: it brings the visitor in with trust already attached | A poor fit between the person and the product, or missing disclosure |
Two findings from the Spiegel study help with weighting. Reviews mattered more as risk rose: for lower-priced products the conversion rate increased 190% when reviews were displayed, and for higher-priced products 380%. And marking reviewers with a verified buyer badge improved the odds of purchase by 15%. Both are 2017 retail figures, not B2B benchmarks, but the direction transfers: the bigger the commitment, the more the visitor needs evidence, and the more they check whether it is real.
Proof that answers the wrong doubt is decoration.
For the demo request example, that means the heavy evidence (a case study with a number, an independent rating) belongs where the 18,600 hesitate over result and price, and light reassurance belongs at the form. Awareness-stage visitors need to recognise themselves, not read a case study.
Where to place social proof on the page
Place proof within sight of the element the visitor decides on, not in a block of its own at the bottom of the page. The decision elements on a demo path are few: the headline that says who the product is for, the pricing table, the form and its button. Each is where a doubt becomes active, and that is where its answer should be.
A carousel above the footer fails on three counts. Most visitors who hesitate at the form never scroll to it. It rotates, so the one quote that fits a given visitor is on screen for a fraction of the time. And it is detached from any claim, so the visitor has to work out what it is evidence of.
Proximity also forces relevance. When a quote has to sit next to the pricing table, “great team” is visibly useless there and the team goes to find the customer who said what the product was worth. When it sits under the demo button, the right quote is about the call, not the product.
- Logos from the visitor’s segment
- One outcome line with a number
- Case study with a measured result
- Independent rating, with count and date
- Certifications that answer a stated risk
- One short quote about the call
- Review score under the button
- Rotating carousels
- A proof section with no claim beside it
- The same block on every page
Rotating quotes, generic praise, last block before the footer
One practical limit: proof near a form must not push the form down or slow the page. One quote and one score are enough. If the page needs a paragraph of reassurance next to the button, the doubt belongs to an earlier step and should be answered there.
What to show each visitor, by stage and source
The same page receives visitors with different doubts, so the proof has to vary by buying stage, by whether the visitor has been before, and by how they arrived. Stage sets the question. History and source adjust it.
- Awareness. The question is relevance. Show who uses the product, in the visitor’s segment, in one line. Long case studies are wasted here.
- Consideration. The question is whether it works and how it compares. Show measured results, independent ratings and reviews that include criticism.
- Decision. The question is risk. Show what reduces the cost of being wrong: compliance marks, the review score, what the first call is like. Then get out of the way.
First-time paid visitors arrived on a promise in an ad, usually without knowing the brand. Their proof should repeat that promise with evidence, in the first screen, from customers that match the campaign’s audience. A paid visitor from a campaign aimed at finance teams who sees a logo strip of consumer brands has been told the page is not for them.
Organic visitors arrived with a question. Proof tied to the topic they searched, such as an expert view or a certification, earns the next click better than a customer quote about something they have not asked yet.
Returning visitors have already seen the logo strip and the headline testimonial. Showing them the same proof again adds nothing. They need the evidence they have not seen (the method, the numbers, a named customer in their segment) or, if their behaviour says they are ready, a clear next step and very little else. If many of your returning visitors still do not convert, the piece on visitors who are not ready to book a call covers what to offer instead.
A static page cannot do this: it shows one block to everyone. You can approximate it with separate landing pages per campaign, which handles source but not stage or history. Doing all three means reading behaviour in the session, which is where personalization for conversion comes in.
Social proof mistakes that lower trust
Proof that looks manufactured does more damage than no proof, because it gives the visitor a reason to distrust everything else on the page. Four patterns cause most of it.
Common mistake: real-time notification popups that show invented or recycled activity, such as “someone just booked a demo” on a loop. Visitors recognise the pattern, it interrupts the page at the wrong moment, and if the activity is not real it is a false claim about your customers. If you use activity notifications at all, show true figures and judge them like any other popup, on conversions against a control. The same test applies to exit-intent popups.
Perfect ratings
The Spiegel study found that purchase likelihood typically peaks at ratings in the 4.0 to 4.7 range and then decreases as ratings approach 5.0. Visitors read a perfect score as curated. BrightLocal’s 2026 survey shows expectations rising at the same time (31% of consumers will only use a business with 4.5 stars or more, and 68% want at least four stars), so the aim is a high score that still looks earned: show the count, the dates and the critical reviews.
Logo walls with no relevance
Twenty logos tell a visitor that companies buy from you. They do not tell a visitor that a company like theirs does. Four logos from the visitor’s own segment beat twenty famous ones from another.
Fake or undisclosed proof
In the US this is now a legal exposure as well as a trust problem. The FTC’s final rule banning fake reviews and testimonials, announced on 14 August 2024 and effective 21 October 2024, prohibits fake consumer reviews and testimonials (including AI-generated ones), buying reviews conditioned on a positive or negative sentiment, insider reviews that do not disclose a material connection, company-controlled review sites presented as independent, review suppression and fake social media indicators. It lets the agency seek civil penalties against knowing violators. This is a summary, not legal advice.
Old proof
With 74% of consumers in the BrightLocal survey looking for reviews from the last three months, a testimonial dated three years ago signals that nobody has said anything good since. Date your proof and replace it on a schedule.
How to measure whether proof raised conversion
Measure social proof on the primary conversion, against a holdout that did not see it. Clicks on a testimonial, video plays and time on the case study page are not the outcome. A proof element can attract attention and move nothing, or be glanced at for a second and remove the doubt.
- Pick one drop point and one change. Several new proof elements at once cannot be told apart afterwards.
- Keep a share of visitors on the unchanged page for the same period. A before and after comparison mixes in seasonality and campaign changes.
- Compare the demo request rate of the two groups, not engagement with the element.
- Read the result by segment (paid and organic, first-time and returning). An effect can be positive in one and flat in another.
- Check the size of the sample before you call it.
Hypothetical example Over 30 days the site in our example sends 48,000 visits to the page with a case study beside the pricing table and holds 12,000 back. The holdout produces 120 demo requests (1.00%) and the new version 552 (1.15%). That is a 15% relative lift and 72 incremental demo requests (552 minus 48,000 x 1.00%). A two-proportion test gives z = 1.40, short of the 1.96 needed for 95% confidence, so the result is promising and not yet proven.
That last step is where most claims about social proof fall apart. A site needs enough conversions in each group to separate a real effect from noise, and many proof tests are stopped the week the number looks good. To judge whether your starting rate is low at all, use conversion rate benchmarks by industry as context, not as a target.
How Pathmonk shows stage-matched proof
Pathmonk automates the third question: which visitor. It reads visitor intent in real time from first-party, cookieless, in-session behaviour (scroll, navigation, dwell), predicts the buying stage (awareness, consideration or decision) and shows a stage-matched microexperience: a small in-page card with an offer, proof or a next step. It does this without changing the page’s indexable content and without developers, and results are measured against a control group.
Forrest Technical Coatings, a B2B industrial coatings manufacturer, shows the pattern. Its conversion event is a sales request, the equivalent of the demo request in our example. According to the case study, visitors predicted to be in the awareness stage saw an introduction clarifying the brand’s expertise, visitors in the consideration stage saw credibility proof (certifications, durability data, product advantages), and visitors in the decision stage got a direct prompt to the sales-request form.
The test started as a 50/50 split against an untouched control group. Over six months the conversion rate was 2.43% with Pathmonk against 1.49% for the control (+63%), with 169 incremental sales requests, and sales requests were up 303% in the first week. The proof described in the case study is the kind most manufacturers already hold: certifications and durability data. What the setup changed was who saw it and when: visitors weighing credibility got the evidence, and visitors who were ready were sent to the form.
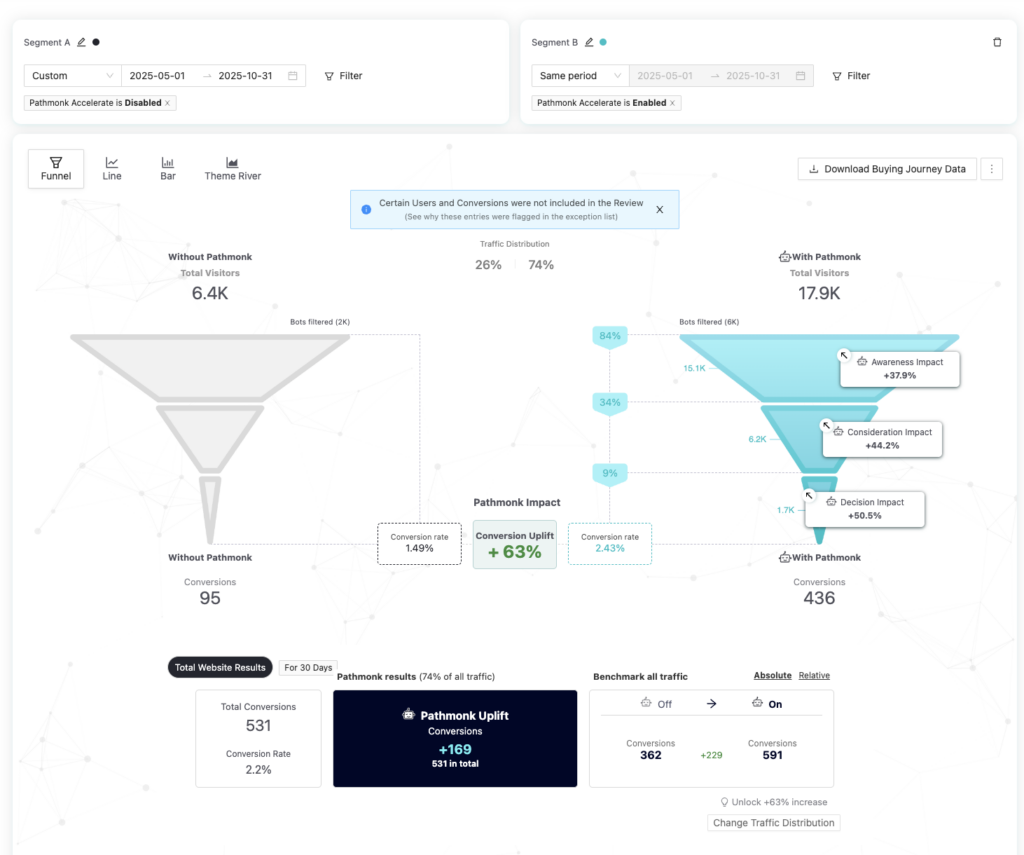
One case does not set an expectation for another site. It does show the mechanism this article describes: existing proof, matched to stage, measured on the conversion against a control.
When social proof will not help
Social proof removes doubt about a sound offer. It does not repair the offer, the traffic or the page. Before investing in it, rule out the cases where it cannot work.
If the step you want to fix sees too few visitors to compare two versions within a few months, you cannot learn which proof works. Choose by judgement, place it by the rules above, and spend the effort on traffic first.
- A pricing or product problem. If visitors leave because the price is out of range or the product lacks something they need, a testimonial saying others were happy does not change their arithmetic.
- The wrong traffic. Visitors with no need for the product do not have doubts to remove.
- Regulated claims. In healthcare and other regulated fields, patient testimonials and outcome claims are restricted in many jurisdictions. Have compliance review any proof that implies a result before it goes live.
- No consent. Using a customer’s name, logo, photo or words requires their permission, and for individuals it involves personal data. Get it in writing and keep a record of what was agreed.
- No real proof yet. A new product with three customers should show those three honestly, with detail. Inflating the picture is the fastest way to the mistakes above.
Key takeaways
- Social proof lifts conversion when it answers the doubt a visitor has at the step where they hesitate. Generic proof shown to everyone is mostly ignored.
- Start from the funnel. Count the loss at each step, split by source and by first-time or returning, and name the doubt behind the biggest loss.
- Choose the type by the doubt: logos for relevance, case studies and ratings for results, certifications and a quote about the call for risk.
- Put proof next to the decision element: the headline, the pricing table, the form. A carousel above the footer is seen too late.
- First-time paid visitors need proof that repeats the ad’s promise. Returning visitors need new evidence or a clear next step.
- A perfect 5.0 looks curated. Spiegel Research Center found purchase likelihood peaks at 4.0 to 4.7 stars.
- Fake reviews and testimonials have been prohibited by a US FTC rule since 21 October 2024. Invented activity popups carry the same trust cost.
- Measure on the primary conversion against a holdout, and check the sample before claiming a lift.
FAQs on social proof and conversion rate
Does social proof increase conversion rate?
It can, when it answers the doubt a visitor has at the step where they hesitate. Spiegel Research Center (2017) found that purchase likelihood for a product with five reviews is 270% greater than for one with none, a retail figure about product reviews. Proof that is generic, misplaced or looks staged usually changes nothing, and can lower trust.
What are the main types of social proof?
Ratings and reviews, customer testimonials and case studies, expert endorsement, certifications and awards, user-generated content, and referrals or celebrity and influencer endorsement. Each reduces a different doubt, so choose the type by what stops the visitor, not by what is on file.
Where should social proof go on a landing page?
Within sight of the element the visitor decides on. Segment logos and one outcome line in the first screen, a case study and an independent rating beside pricing, and one short quote with the review score next to the form button. Avoid rotating carousels at the bottom of the page.
What social proof should first-time paid visitors see?
Proof that repeats the promise made in the ad, in the first screen, from customers that match the campaign’s audience. Returning visitors have seen that already and need evidence they have not seen, or a clear next step if their behaviour shows they are ready.
Is a 5-star rating best for conversions?
No. Spiegel Research Center found that purchase likelihood typically peaks at ratings between 4.0 and 4.7 and decreases as ratings approach 5.0. A high score with visible critical reviews, a review count and recent dates is more credible than a perfect one.
Are fake reviews and testimonials illegal?
In the United States, the FTC’s rule on consumer reviews and testimonials has been in effect since 21 October 2024. It prohibits fake reviews and testimonials, including AI-generated ones, buying reviews conditioned on sentiment, and undisclosed insider reviews, and allows civil penalties against knowing violators. Rules differ in other countries, so check locally.
How do you measure the impact of social proof?
Change one element at one drop point, keep a holdout group on the unchanged page for the same period, and compare the rate of the primary conversion between the two groups. Do not judge by clicks on the testimonial, and check that the sample is large enough before calling the result.
- Spiegel Research Center, How online reviews influence sales (2017) (spiegel.medill.northwestern.edu)
- BrightLocal, Local Consumer Review Survey 2026 (brightlocal.com)
- Federal Trade Commission, final rule banning fake reviews and testimonials (2024) (ftc.gov)
- Federal Register, Trade regulation rule on the use of consumer reviews and testimonials, 16 CFR Part 465 (2024) (federalregister.gov)